Graphy
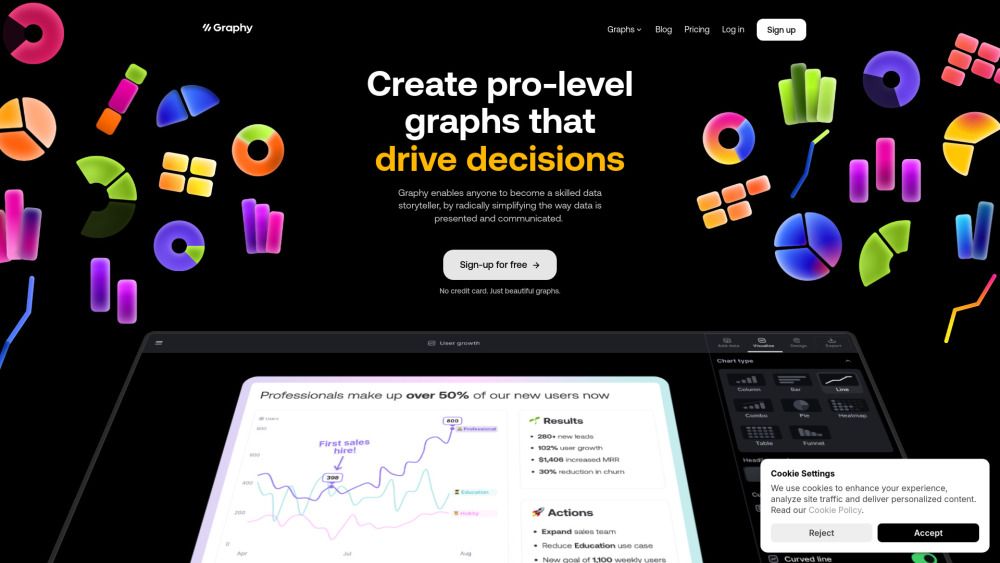
Graphy enables anyone to become a skilled data storyteller, by radically simplifying the way data is presented and communicated.
What is Graphy?
Graphy is a powerful tool designed to empower users to become skilled data storytellers by simplifying the presentation and communication of data. It provides an intuitive platform that allows anyone, regardless of their technical expertise, to create compelling visual narratives from their data.
With Graphy, users can take advantage of a variety of features that enhance their data storytelling experience, including:
AI-powered graph creation
Google Sheets integration
Interactive visualizations
Collaborative features for team decision-making
Instant sharing options
Graphy Features
Graphy is designed to empower users to become proficient data storytellers by simplifying the presentation and communication of data. It offers a range of features that enhance the user experience and facilitate effective data visualization.
Key capabilities of Graphy include:
AI-powered graph creation
Integration with Google Sheets
Data storytelling capabilities
Interactive visualizations
Light/Dark mode options
API access for developers
Support for multiple graph types
Collaborative features for team projects
Instant sharing options for easy distribution
Why Graphy?
Graphy offers a powerful solution for transforming complex data into visually appealing and actionable insights. By simplifying the way data is presented, it enables users to create professional-level graphs that not only impress their audience but also drive decisions and inspire actions. This ease of use is particularly beneficial for data-driven teams, allowing them to communicate effectively without the confusion often associated with traditional graphing tools.
Some of the key benefits of using Graphy include:
Radically simplifies data presentation and communication.
Enables anyone to become a skilled data storyteller.
Facilitates faster decision-making with fewer meetings.
Allows for seamless collaboration and sharing across various platforms.
Trusted by over 100,000 users for its reliability and effectiveness.
How to Use Graphy
Getting started with Graphy is simple and intuitive, allowing anyone to become a skilled data storyteller. To begin, sign up for free without the need for a credit card, and you can start creating beautiful graphs in seconds. Graphy offers a variety of graph types, including line graphs, bar graphs, pie charts, and more, making it easy to visualize your data effectively.
Once you have signed up, you can explore the features that Graphy provides to enhance your data presentation. Here are some benefits of using Graphy:
Create professional-level graphs that inspire action and drive decisions.
Collaborate with your team by sharing graphs through interactive links or embeds.
Utilize multiple graph types to present data from various sources in one place.
Ready to see what Graphy can do for you?and experience the benefits firsthand.
Key Features
AI-powered graph creation
Google Sheets integration
Data storytelling capabilities
Interactive visualizations
Light/Dark mode
How to Use
Visit the Website
Navigate to the tool's official website
What's good
What's not good
Choose Your Plan
Free
- 5 charts
- share anywhere
- limited AI use
Plus
- Everything in Free
- brand colors
- remove watermark
- unlimited charts
- unlimited AI features
Business
- Everything in Plus
- dedicated support
- enhanced privacy controls
Graphy Website Traffic Analysis
Visit Over Time
Geography
Loading reviews...
Frequently Asked Questions
Introduction
Graphy is an innovative platform that empowers users to effortlessly create visually compelling data presentations, transforming complex information into clear, actionable insights. With features like AI-powered graph creation and seamless integration with tools like Google Sheets, Graphy simplifies data storytelling for over 100,000 teams, making it easy to collaborate and share insights in real-time.
Added on
Mar 04 2025
Company
Graphy Technologies Ltd.
Monthly Visitors
114,692+
Features
AI-powered graph creation, Google Sheets integration, Data storytelling capabilities
Pricing Model
Free, Plus, Business