ChartPixel

What is ChartPixel?
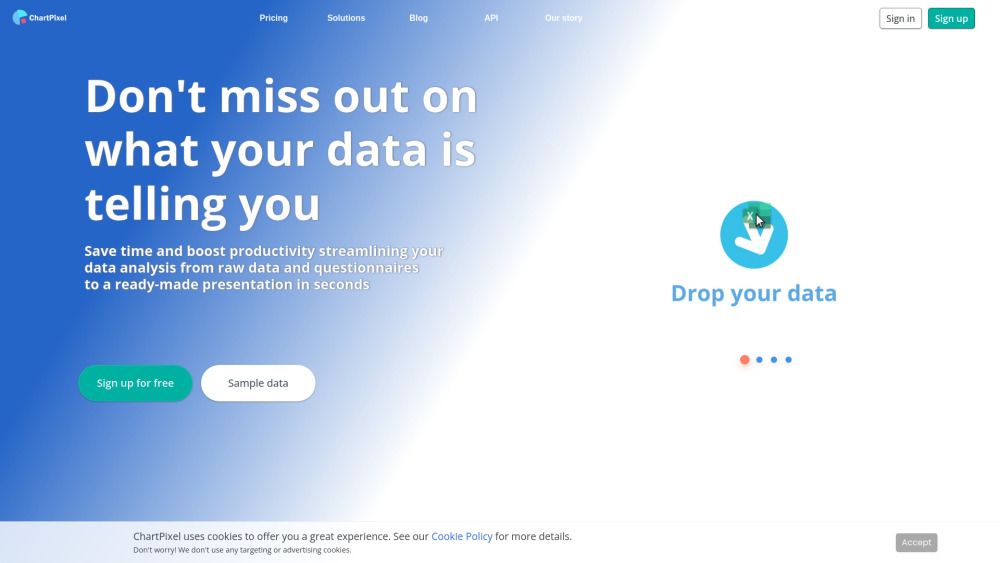
ChartPixel is an innovative AI-assisted data analysis platform designed to simplify the process of data visualization. By transforming raw data into meaningful insights, it empowers users to make informed decisions quickly and easily.
Whether you're a business analyst or a casual user, ChartPixel streamlines the extraction of insights, allowing you to focus on what truly matters—understanding your data.
ChartPixel Features
ChartPixel boasts a range of powerful features tailored for effective data analysis. Its automated data cleaning and formatting save valuable time, while interactive chart creation enables users to engage with their data dynamically.
AI-assisted data insights generation
Automated data cleaning and formatting
Interactive chart creation
One-click export to PowerPoint
With these functionalities, ChartPixel ensures that users can visualize complex datasets without the need for extensive technical knowledge.
Why ChartPixel?
ChartPixel stands out in the crowded field of data analysis tools due to its user-friendly interface and robust AI capabilities. It allows users to analyze various types of data effortlessly, making it suitable for diverse applications.
From improving customer services through survey analysis to visualizing sports statistics for performance tracking, ChartPixel provides tailored solutions that meet specific needs.
How to Use ChartPixel
Getting started with ChartPixel is straightforward. Simply upload your data in various formats, and the platform will automatically generate insightful charts and explanations to guide your analysis.
Ready to enhance your data visualization experience?
How to Use
Visit the Website
Navigate to the tool's official website
What's good
What's not good
ChartPixel Website Traffic Analysis
Visit Over Time
Geography
Loading reviews...
Introduction:
AI tool for easy data visualization and insights extraction.
Added on:
Feb 17 2025
Monthly Visitors:
8,949+